


Click the button to start reading
The Ultimate Guide to Measuring Performance with Marketing KPIs
Introduction:
Data drives decisions, and as a marketer, your job is to make a measurable difference to the business with your creativity.
Whether the goal is to drive conversions or sign people up to a mailing list, tracking what’s working helps the team to focus on the right things and avoid wasting money on what doesn’t work.
KPIs (key performance indicators) are a simple and effective way of doing just that.
Put simply, a KPI helps you to track some aspects of your marketing efforts to present a positive or negative result. It’s a method of data collection that’s been used in many departments of a business.
In this article, we’ll look closer at KPIs and their place within your marketing campaigns. We’ll also share our picks of the most important KPIs to consider.

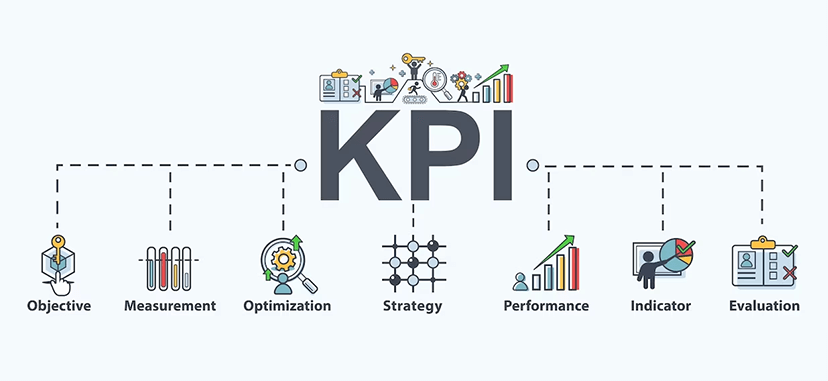
What is a KPI?
A KPI (key performance indicator) is a fancy term for tracking progress toward specific goals.
It’s like keeping score in a game, but instead of points, you measure website traffic, conversion rates, or customer satisfaction.
The great thing about KPIs is that they help businesses and marketing teams to see what’s working and what’s not, so they can focus their efforts on the things that are making a difference. It’s like having a roadmap to success – you know where you’re going and can see how far you’ve come.
For example, a KPI for a marketing team might be the number of leads generated or the percentage of website visitors who end up making a purchase.
Choosing the right KPIs is important because they should align with the organization’s overall mission and objectives. Effective KPIs are also measurable, relevant, and timely – meaning you can track progress, relate to your specific goals, and are updated regularly.

What Are KPIs In Marketing?
As a marketer, you know your job is to help grow the business and increase revenue. And to do that, you must ensure your campaigns are working effectively.
That’s where KPIs come in.
KPIs are like a compass for marketers, helping them steer their efforts in the right direction. With KPIs, you can see whether your campaigns drive the desired results and adjust your strategies accordingly.
This helps you avoid wasting valuable ad dollars through methods like A/B testing, incremental testing, and retargeting.
Since the implementation of regulations such as GDPR and CCPA, marketers can’t rely on third-party data acquisition as much and, therefore, must rely more on their first-party data and be able to interpret those results through KPIs. This means that it’s more important than ever to understand the metrics that truly matter and how to track them effectively.
According to recent studies, businesses of all sizes agree that first-party data collection is the most important aspect of a digital media strategy. In fact, 85% of small businesses and 86% of medium to large businesses agree that first-party data is critical to success.
KPIs are also an excellent way for marketers to track professional work goals and show how their efforts contribute to the business’s overall success. By setting clear and measurable KPIs, marketers can demonstrate the impact of their work on the company’s bottom line.
So, what are some of the top objectives for marketers?
According to research, increasing customer loyalty, improving conversion rates, and optimizing the customer journey are among the most important goals. And with the right KPIs in place, you can ensure that your campaigns drive towards these objectives and ultimately help to grow the business.
The Most Beneficial KPIs for Marketing
Now that we’ve discussed KPIs and how they can benefit marketing teams, it’s time to take a deeper look at the most important metrics.
Here are the best marketing KPIs to create data-driven decisions:
Return on Investment
When measuring the success of your marketing campaigns, there are few metrics as important as return on investment (ROI). Consider it the ultimate test of whether your marketing efforts are worth the investment.
The beauty of ROI is its simplicity. It’s just a matter of taking the revenue generated by a marketing campaign and, subtracting the cost of that campaign, then dividing the result by the cost of the campaign. The resulting percentage is the ROI.
Suppose you spent $10,000 on a marketing campaign and generated $50,000 in revenue. Your ROI would be 400%. That’s an impressive figure that shows you’re getting a great return on your investment.
A high ROI clearly indicates that your marketing efforts are paying off. It’s proof that you’re generating significant revenue relative to your investment.
When tracking ROI, it’s essential to remember that it’s not a static metric. ROI can change over time, depending on the state of the market, your competition, and your own marketing efforts.
Conversion Rate
Conversion Rate is another important KPI for marketing. It measures the percentage of website visitors or ad viewers who take a desired action, such as making a purchase or filling out a form.
Essentially, it measures the effectiveness of your website or ad in converting visitors into customers or leads.
To calculate conversion rate, divide the number of conversions (e.g., purchases or form submissions) by the number of visitors or ad viewers, and multiply by 100 to get a percentage.
For example, if 1000 people visit your website and 50 make a purchase, your conversion rate is 5% (50/1000 x 100).
Conversion rate is an important KPI because it can help you understand how well your website or ad is performing in terms of converting visitors into customers or leads.
A high conversion rate indicates that your website or ad is effective at convincing visitors to take the desired action, while a low conversion rate may suggest that you improve your messaging or design to better persuade visitors to take action.
Customer Acquisition Cost
Customer Acquisition Cost (CAC) measures the cost of acquiring a new customer. This metric is important because it can help businesses determine the return on investment of their marketing and sales efforts.
Calculating CAC involves adding up all the costs associated with acquiring a new customer, including marketing and advertising expenses and sales and support costs.
Once you have a total cost, you can divide it by the number of new customers you acquired during a specific period to get your CAC.
For example, if you spent $10,000 on marketing and sales efforts in a given month and acquired 100 new customers, your CAC would be $100 ($10,000 divided by 100 customers).
If CAC is consistently high, it may indicate that changes need to be made to the sales process or that the marketing message is not resonating with the target audience.
Customer Lifetime Value
Customer Lifetime Value (CLV) is a crucial KPI for any business, including those in the marketing field. It measures the total value a customer brings to a business over the entire relationship duration.
To calculate CLV, businesses can take the average value of each customer’s purchases and multiply that by the estimated number of purchases a customer will make over their lifetime.
For example, if the average customer spends $100 per purchase and makes an estimated 10 purchases over their lifetime, their CLV would be $1,000.
Having a high CLV is important because it means a business generates more revenue from each customer throughout its relationship. This is often achieved through effective marketing strategies focusing on customer retention and loyalty.
Churn Rate
Churn rate is a KPI particularly important for businesses that rely on recurring revenue, such as subscription-based services.
It’s calculated by dividing the number of customers lost during a specific period by the total number of customers at the beginning of that period.
For example, if you had 1,000 customers at the beginning of the month and lost 50 customers by the end of the month, your churn rate would be 5%. A high churn rate can indicate that a business needs a change to retain its customers, which can be a significant obstacle to sustainable growth.
Traffic-to-Lead Ratio
The Traffic-to-Lead Ratio is a KPI that measures the percentage of website visitors who turn into leads by taking action. This action can be anything from filling out a form to signing up for a newsletter.
For example, if 1000 people visit your website in a given period, and 50 of them fill out a form to download a whitepaper or subscribe to a newsletter, your Traffic-to-Lead ratio would be 5%.
A high Traffic-to-Lead ratio suggests that your website is doing an excellent job of attracting the right kind of visitors and getting them interested in your business.
On the other hand, a low Traffic-to-Lead ratio indicates that you may need to make some changes to your website, such as improving the design, making it easier for visitors to find what they’re looking for, or creating more compelling calls to action.
Landing Page Conversion Rates
When it comes to online marketing campaigns, landing pages play a critical role in converting website visitors into customers. That’s where landing page conversion rates come in as a key performance indicator.
This metric measures the percentage of visitors to a landing page who take a desired action, such as making a purchase, filling out a form, or subscribing to a newsletter.
A high conversion rate means that the landing page is resonating with visitors and compelling them to take action, while a low conversion rate suggests that the landing page may need some optimization to improve its effectiveness.
Marketers can improve landing page conversion rates by testing headlines, images, and calls to action to determine what resonates best with their audience. By continuously testing and optimizing landing pages, marketers can increase their conversion rates, which leads to more customers and revenue for the business.

Cost Per Click
Cost per click (CPC) is a common metric used in digital advertising to measure the cost of each click on an ad. This KPI evaluates the cost-effectiveness of paid search and display advertising campaigns and can help marketers optimize their campaigns for better performance.
CPC is calculated by dividing the total cost of a campaign by the number of clicks generated by that campaign. For example, if you spent $100 on a campaign and generated 50 clicks, your CPC would be $2.
If your CPC needs to be lowered to save on business expenses, you may need to adjust your targeting, ad copy, or bidding strategy to improve your results and reduce costs.
Website Traffic (Organic and Paid)
Website traffic is a term that refers to the number of people who visit a website during a certain period of time. This metric is important for marketers because it gives them an idea of how many people are interested in their brand or product and how effectively their marketing strategies drive traffic to their website.
There are two main types of website traffic: organic and paid.
Organic traffic refers to visitors who find the website through search engines, social media, or other online channels without the website owner paying for it.
Paid traffic, however, is generated through paid advertising campaigns, such as pay-per-click (PPC) ads.
Net Promoter Score
Net Promoter Score (NPS) is a metric that measures customer satisfaction and loyalty by asking customers how likely they are to recommend a company to others.
The NPS survey typically asks customers to rate the likelihood of recommending a company on a scale of 0 to 10.
Customers who give a score of 9 or 10 are considered “promoters,” while those who give a score of 7 or 8 are “passives,” and those who give a score of 0 to 6 are “detractors.”
The NPS is calculated by subtracting the percentage of detractors from the percentage of promoters. This results in a score between -100 and 100, with a higher score indicating higher customer satisfaction and loyalty.
View Counts and Impressions
View count refers to the number of times a piece of content has been watched, listened to, or otherwise consumed, while impressions refer to the number of times a piece of content has been displayed or appeared on a user’s screen.
These metrics are commonly used in social media marketing, video marketing, and other forms of digital marketing to measure the success of a campaign or piece of content.
They can provide insight into how many people are seeing and interacting with the content and help managers make informed decisions about optimizing and promoting their content for maximum visibility and engagement.
Click-through Rate
Click-through rate (CTR) shows the percentage of people who clicked on a link or ad after seeing it. It can be used to evaluate the performance of email campaigns, paid search ads, social media ads, and other types of online marketing.
To calculate CTR, you divide the number of clicks between a link or ad by the number of impressions (or views) of that link or ad, then multiply by 100 to get a percentage.
For example, if an ad was shown 1,000 times and received 50 clicks, the CTR would be 5% (50 clicks ÷ 1,000 impressions x 100).
A high CTR is generally seen as a positive indication of the relevance and effectiveness of an ad or campaign, while a low CTR may suggest that the ad or campaign needs to be improved.
It’s essential to keep in mind, however, that CTR should be considered in context with other metrics, such as conversion rate and ROI, to get a more complete picture of campaign performance.
Engagement Rate
Engagement rate is a KPI that measures how actively customers or followers engage with a brand or content.
It tells you how interested and involved your audience is with your brand. This can include actions like liking, commenting, sharing, and other interactions on social media, as well as email opens and clicks and website engagement.
To calculate the engagement rate, you need to divide the number of engagements (likes, comments, shares, etc.) by the number of impressions (the number of times the content was viewed). The resulting percentage is the engagement rate.
A high engagement rate indicates that your target audience is interested in your brand or content and finds value in your offering. This can increase brand loyalty, customer retention, and even more conversions and sales.
Share-of-Voice
Share-of-Voice is a metric that measures how much of the overall conversation around a particular topic or brand is attributed to a specific company or product. It’s a way to evaluate your brand’s presence and impact in a given market.
You can determine your Share-of-Voice by comparing the percentage of conversation that your brand is responsible for. For example, if 1000 social media posts were in your industry in a given month and your brand was mentioned in 250, your Share-of-Voice would be 25%.
Share-of-Voice can provide valuable insights into your brand’s visibility and reputation in the market and help you identify opportunities for growth and areas where you may need to improve your marketing efforts.

Social Shares
Social shares are a metric that measures the number of times a piece of content, such as a social media post or blog article, has been shared on social media platforms. It’s a way to gauge engagement and interest in the content and the brand.
When people share content, it helps to extend the reach of the content and increase brand awareness. It can also indicate the level of loyalty and advocacy that customers or followers have for the brand.
Not every KPI we’ve mentioned today will be directly relevant to your organizational goals but it is important to carefully choose and prioritize the KPIs that align with your overall objectives.
By regularly tracking and analyzing your KPIs, you can gain valuable insights into your organization’s performance and make data-driven decisions to improve your business operations. Remember to keep in mind that KPIs are not static and may need to be adjusted over time as your business evolves and your goals change.
Regularly reassessing and refining your KPIs can help ensure that you stay on track and continue to drive success for your organization.
Conclusion
Not every KPI we’ve mentioned today will be directly relevant to your organizational goals but it is important to carefully choose and prioritize the KPIs that align with your overall objectives.
By regularly tracking and analyzing your KPIs, you can gain valuable insights into your organization’s performance and make data-driven decisions to improve your business operations. Remember to keep in mind that KPIs are not static and may need to be adjusted over time as your business evolves and your goals change.
Regularly reassessing and refining your KPIs can help ensure that you stay on track and continue to drive success for your organization.