

Click the button to start reading
Simplify Complex Projects with Visual Project Management
Have you ever been in a meeting that started with promising ideas only to devolve into confusion? Is it challenging to digest a three-page project status report on a weekly basis? Are you constantly trying to keep a dozen balls in the air without dropping any?
When traditional methods fail, you have no other choice. You start looking for ways to prioritize tasks and clear the confusion.
That’s when visual project management comes into play. Why? Because it’s a way to see your entire project at a glance, with all the parts neatly organized and color-coded for easy understanding.
By using graphics, charts, and other visual aids, project managers can turn complex data into simple and actionable insights. Ready to explore the types and benefits of visual project management software? Let’s dive in.

What is visual project management?
Visual project management is like a dashboard for your project. Just as a car dashboard offers real-time information about your car’s performance, visual project management tools equip you with up-to-date information about your project’s performance.
Think about it – when you’re driving a car, you need to be able to see important information such as your speed, fuel level, and engine temperature at a glance. Without this information, you’d be driving blind and could end up with a breakdown or accident. In a word, visual project tools allow you to see the status of each task, the overall progress, and any potential risks that may arise.

How to incorporate visual communication in projects
Start with these four essential steps:
- Choose the appropriate tools: Among the wide selection of software, determine the tool that best fits your project and team’s needs.
- Learn how to use the selected tools: Once done, learn how to use the software. You can find tutorials online or consider taking a training course to understand the tool’s capabilities and features better.
- Explain the benefits: Communicate to your team how using such tools can improve collaboration, transparency, and productivity.
- Introduce the visual project management tool to your team. Demonstrate how it works and which features are necessary to manage the project. Encourage team members to ask questions and offer feedback on the tool.
Follow these steps to incorporate visual project tools and ensure your team uses them effectively.
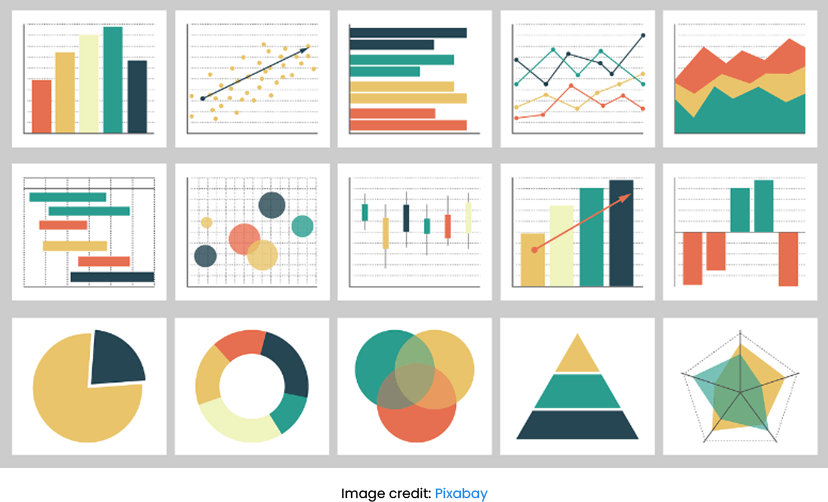
Types of visual project management tools
- Kanban boards
- Scrum boards
- Gantt chart
- Mind maps
- Dashboards
- Swimlane diagrams
Kanban boards

Kanban boards are visual project management tools that provide a simple and effective way to manage tasks and workflows. Originating from the Japanese word for “billboard” or “signboard,” Kanban boards were first used in the manufacturing industry to improve efficiency and productivity.
To clarify, the Kanban board consists of a visual representation of the workflow, divided into columns that show the different stages of the process. Cards or sticky notes represent tasks, moving across columns as they progress in the workflow.
Striving to deliver more value to your customers? Kanban boards are highly customizable and can be adapted to suit the needs of any project or team. They’re often used in agile project management methodologies, such as Scrum or Lean.
Want to work together to resolve any issues? One of the key benefits of Kanban boards is that they make it easy to identify bottlenecks, track progress, and prioritize work. They also promote collaboration and communication within the team, as everyone can see the status of each task.
Used in a wide range of industries, Kanban boards apply to all projects, from marketing campaigns to software development to construction. They’re powerful and flexible tools to improve efficiency, reduce waste, and deliver high-quality results.
How to use Kanban Boards in project management?
Here’re the key steps to using Kanban boards in project management:
- Define the workflow: Start by defining the workflow for your project. This should include all the stages that tasks will go through from start to finish. For example, your workflow might include columns for tasks that are to-do, in progress, and done.
- Create cards for tasks: Once you have defined your workflow, create cards for each task that needs to be completed. In this case, each card should represent a single task and include details such as the task name, description, and due date.
- Move cards across the board: As work progresses, move the cards across the board from one column to the next.
- Limit work in progress: To prevent tasks from piling up and causing delays, limit the number of tasks that can be in progress at any one time.
- Use metrics to optimize workflow: While using the Kanban board, track metrics such as lead time and cycle time to identify areas for improvement in your workflow. For example, if you find that tasks are spending too much time in the in-progress column, you may need to reassess your team’s capacity or the complexity of the tasks.
Best visual tools for Kanban
- Teamly: a project management tool that offers a Kanban board to reflect your team’s unique workflow. You can define columns, add cards, and set up labels to help categorize and prioritize tasks. Get step-by-step instructions on how to use Teamly’s Kanban boards to speed up project delivery. Teamly also offers Team Goals Kanban Board Template and Business Plan Kanban Board Template.
- Teamwork: A project management platform to visualize your work with Kanban boards, plan your workload, track progress, optimize workflow, and enhance reports.
Scrum boards
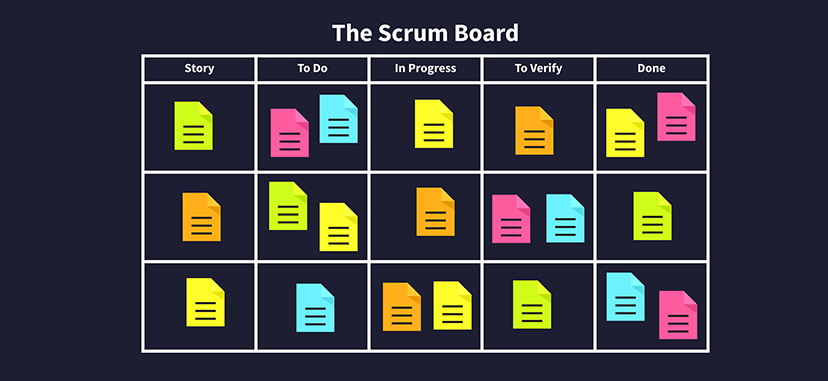
Imagine a bustling construction site where workers perform a range of tasks to complete a project. The Kanban board, in this scenario, is like a well-oiled machine, with workers moving the project forward by completing their tasks and passing them along to the next worker. Each task represents a work item, and each worker represents a stage of the workflow. The objective is to ensure the construction project moves smoothly and efficiently.
The Scrum board, on the other hand, is like a project manager overseeing a specific part of the construction project. You organize tasks within a sprint. The goal is to complete as many sprints as possible during the project while maintaining a consistent pace and quality.
In the early 1990s, Scrum was developed by Jeff Sutherland and Ken Schwaber in response to traditional project management challenges. This flexible, collaborative framework gained popularity and now manages complex projects in many industries.
Typically, Scrum boards use a visual “push” system, where you move tasks from a backlog to an “in progress” column and then to a “done” column as they’re completed. In short, you use Scrum boards for tracking progress within specific sprints.
How to use scrum boards?
In project management, follow a few steps to make the most out of Scrum boards:
- Set up the board: Start by setting up the Scrum board with the necessary columns to represent the various stages of the project. The most common columns are “To Do,” “In Progress,” and “Done.” You may also want to include additional columns for items such as backlog, testing, or review.
- Break down the tasks required to complete the project into manageable pieces. Each task should be small enough to be completed within a sprint (a fixed time period, typically two weeks).
- Prioritize the tasks paying attention to urgency and importance. This helps to ensure that the team is working on the most important tasks first.
- Hold daily stand-up meetings to review progress and identify any blockers or challenges. Make sure the entire team is on the same page and can address issues quickly.
- Review and adapt: At the end of each sprint, hold a retrospective meeting to review what went well and what could be improved. Use this feedback to adapt the process and make improvements for the next sprint.
Best tools to create Scrum boards
- Jira: A project management tool that includes a Scrum board feature. Among its features, you’ll find drag-and-drop functionality, swimlanes, and filters to help you manage your Scrum process.
- Monday: Monday is a web-based project management tool that offers a Scrum board template. You’ll be able to use customizable columns, color coding, and collaboration features.
Gantt chart
Gantt charts were first introduced by Henry Gantt, an American engineer and management consultant, in the early 20th century. Originally used in manufacturing and construction projects, Gantt charts have since been adapted for use in project management in various industries.
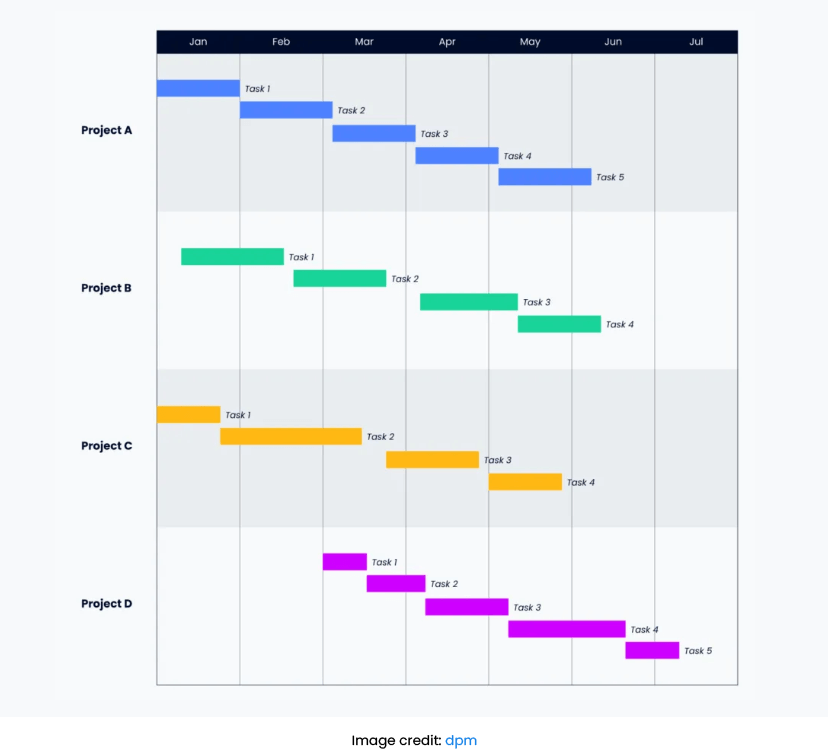
A Gantt chart is like a picture of a project schedule. It shows all the tasks in a project as horizontal bars on a timeline. The left end of the bar shows when the task starts, and the right end shows when it finishes. The longer the bar, the longer the task will take. By looking at the chart, you can see which tasks come first and which ones you’ll need to complete later.
One of the sought-after benefits? The possibility of sharing Gantt charts with clients and team members, providing a clear picture of the project status. In addition, you can use Gantt charts to allocate resources efficiently; team members can see when their skills and expertise are needed and plan their work accordingly.
How can project managers use Gantt charts?
Start with these five easy steps to up your visual project management game:
- Identify and list all the tasks: Start by listing all the tasks that you need to complete in the project and estimate how long each task will take to complete.
- Determine task dependencies: Determine which tasks must be completed before others can begin, and identify any other task dependencies.
- Establish the timeline: Determine the project’s overall timeline, considering the task dependencies and estimated task durations.
- Create the Gantt chart: Use project management software to create a Gantt chart that includes all the tasks, their duration, task dependencies, and assigned resources. The Gantt chart should also display the timeline for the project.
- Monitor and update the Gantt chart: Regularly monitor the progress of the project and update the Gantt chart as needed. This includes updating task completion dates, adjusting resource allocation, and addressing any delays or issues that arise.
Popular visual Gantt chart tools
- Microsoft Project: MS Project allows you to create large Gantt Charts to keep track of tasks, timelines, and deadlines during a project.
- Smartsheet: This tool enables you to customize your project’s timeline, adjust tasks, highlight critical paths, and track progress in real-time.
Mind maps
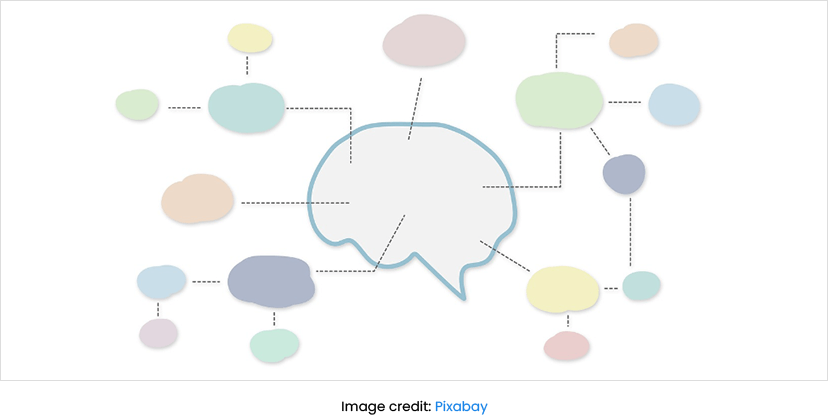
A visual tool for organizing and presenting ideas and information. Mind maps are diagrams that start with a central idea or topic and branch out to show related ideas and concepts. Mind maps are often used for brainstorming, note-taking, project planning, and problem-solving.
The concept of mind mapping was first popularized by Tony Buzan, a British author and educational consultant, in the 1970s. Buzan believed that mind maps were an effective way to unlock the brain’s full potential and improve learning and creativity.
By the way, survey results reveal that 41% of users of mind mapping software are saving an average of 1 to 3 hours a week by using it.
How to use mind maps in project management
Mind maps can be a useful tool in project management for brainstorming, planning, and organizing ideas and tasks. Here’re some ways to use mind maps in project management:
- Brainstorming: Use a mind map to brainstorm ideas for a project. Start with the central idea of the project and then add branches for different ideas, tasks, and subtasks related to the project.
- Project planning: Plan out the different phases and milestones of a project. Start with the main project goal and then add branches for different stages, tasks, and timelines.
- Task management: Create a branch for each task, with sub-branches for deadlines, resources needed, and any other relevant information.
- Risk management: Build branches for different risk categories, such as technical risks or financial risks, and then add sub-branches for specific risks and mitigation strategies.
- Collaboration: Add a shared mind map where team members can add ideas, tasks, and feedback in real time.
The best visual project tools to create mind maps
- Lucidchart: You can import data from spreadsheets and other tools to create a mind map. You can also start from scratch with the drag-and-drop feature. With comment threads and in-editor chat, Lucidchart is fit for mind mapping with on-site and remote teams.
- Miro: Allows you to start with a blank board and add shapes, lines, and text to create branches for different ideas or tasks. Use one of Miro’s pre-built templates to kickstart your mind map and customize it as you go. Provides real-time collaboration and sharing features, too.
Dashboards
In project management, a dashboard visually represents key metrics and data related to a project or team. It provides a quick overview of the status of the project, highlighting any issues or risks that need to be addressed.
Dashboards include graphs, charts, and other visualizations to display KPIs, such as progress against milestones, budget, and resource utilization. Customize them to view the metrics and data most relevant to the project or team.
Using a dashboard allows project managers to quickly assess the status of a project or team and make informed decisions. More importantly, they help spot trends and improve transparency and accountability for stakeholders.
Project management tools for making the most out of dashboards:
- Teamly: Teamly is a visual project management software that offers a dashboard feature. Use it to track key metrics such as project status, budget, labor expenses, timeline, and resource utilization. With Teamly, you can visualize all this data in charts and graphs. Also, you can customize your dashboard’s layout and format to suit your specific needs and preferences.
- Asana: Allows teams to focus on current tasks, collaborate with coworkers across functions and see where things are getting bogged down.
Swimlane diagrams
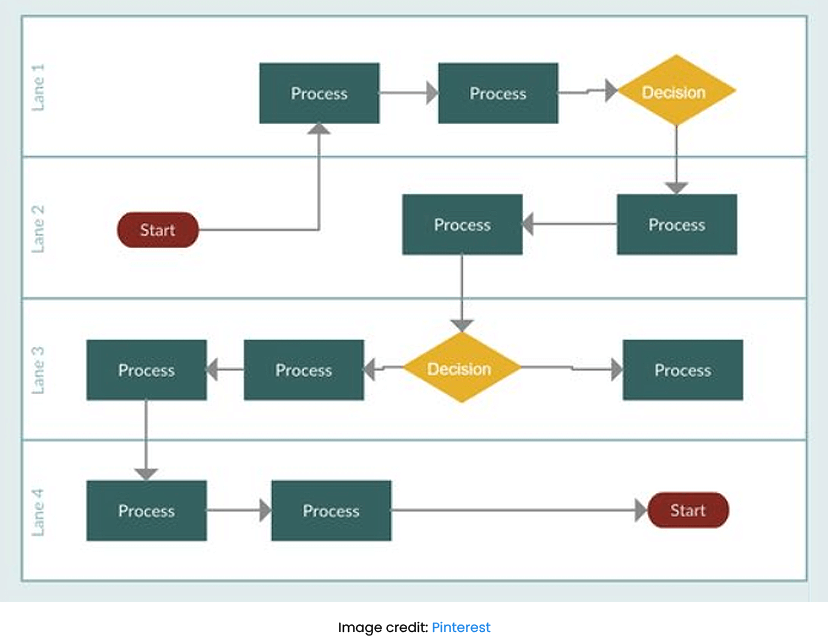
Swimlane diagrams are like a map showing traffic lanes on a busy highway. Each lane of traffic has its own designated space and purpose, right? Similarly, each swimlane in a diagram represents a separate step or activity in a process.
Look at the diagram. You can see how each lane or step interacts with the others and how they all work together towards a common goal. In the same way that a map can help you navigate a busy road, a swimlane diagram can help you navigate a complex process.
The exact origin of swimlane diagrams is unclear, but most probably, they date back to the 1940s or 1950s as a way to represent business processes. Տhe concept became popular later in the 1960s; industrial engineers used swimlane diagrams to map out manufacturing processes.
Today, various industries widely use swimlane diagrams in project management and process improvement, acknowledging them as a valuable tool for improving efficiency and communication in complex processes.
Swimlane diagrams, also known as cross-functional flowcharts, are used to visualize processes that involve multiple stakeholders or departments. Each department or stakeholder is a “swimlane” in a swimlane diagram. Horizontal arrows represent the process flow moving across the swimlanes.
Being a useful tool, Swimlane diagrams pinpoint inefficiencies in processes, especially those with handoffs between stakeholders. They visually indicate who is responsible for each process step.
The best visual tools to create swimlane diagrams
- Gliffy: A diagramming tool to create swimlane diagrams and other types of diagrams. It’s a good option if you’re looking for a tool that is easy to use and offers a lot of customization options.
- Draw.io: This is an open-source diagramming tool. A good option if you’re on a tight budget, as it’s completely free to use.
Let’s sum it up!
With the power of visuals, you can transform your project management approach on the fly. Make one choice and go from chaos to clarity! Visual project management gives you a concise overview of tasks, resources, and team performance.
Like a car dashboard helps you drive safely, visual project management tools help you track progress and nip problems in the bud. Whether you’re an experienced project manager or just starting out, visual tools are your key to unlocking success.